Stock Market Commentary & Analysis October 30, 2019

The stock market had an excellent trade again on Tuesday as the S&P 500 and Nasdaq Composite index closed at record highs.
There were numerous visible factors in the on-going stock market rally. There was resumed optimism for a possible "Phase One" trade deal between the United States and China.
Third-quarter earnings season proceeds to be right with more companies topping estimates than is usual - although, the beats are much tinier than average. Also, the backing was evolving faith that the Federal Reserve would assuredly cut-rate today.
Some individual companies were contributing, as well. Microsoft Corp. boosted the technology sector, surging nearly 3% after it was granted a $10 Billion (That's with the 'B') Federal government contract on cloud computing service.
The stock market action
The stock market rally was relatively broad, with nine of the eleven S&P 500 industry sectors moving higher. While the market rally was full and extensive by the industry sector, it wasn't as widespread in the number of advancing stocks.
Another technical market divergence which eased the bulls' enthusiasm was that while the S&P 500 index surged to a record close, less than ten percent of its segment stocks advanced to 52-week highs.
That is not very bearish; however, this is not the kind of bullish move support one would expect to observe at a record high postings.
After the market closing bell, there were several bursts of satisfaction and comfort level display one might expect at record closing prices.
That led many investors and traders to question if this market rally might be set to stall. That could arise if some investors and traders look to reduce their risk profiles as the market is heading into today's widely expected Federal Reserve interest rate cut.
Never the less that could be the straw that broke the camel's back, as the market believes that Fed Chairman Powell will attempt to dispirit market expectations in his press conference comments.
This scenario could make the next several days of trading sessions exciting - We shall see. By the way, this is why I have recommended on October 16 to partially or all long S&P 500 index trades to be dumped in the $3008 and $3040 area. (See S&P 500 Index, Daily Chart Analysis October 16)
Among other financial assets, Bitcoin cryptocurrency continues to consolidate its recent Chinese spurred gains - Currently is trading around $9,100 to $9,400 range.
Gold metal is a tad lower, sliding back below $1,500 level. Crude oil eases further with West Texas Intermediate (WTI) trading near $55.50. The Euro Dollar shows small up change against the U.S. Dollar, and yields are mostly flat.
Click the Image to Enlarge
Technical Analysis and Outlook
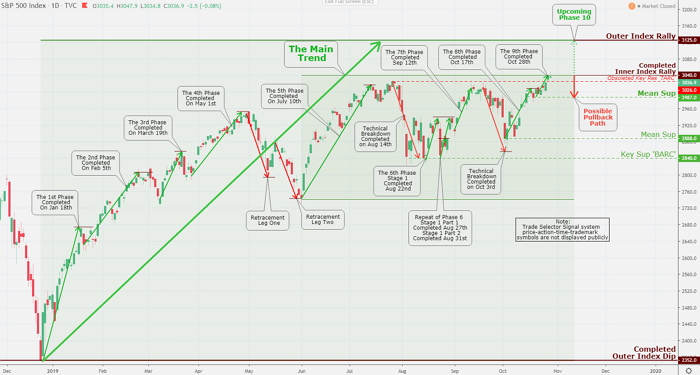
The market is looking particularly vulnerable at this time, especially after the completion of Inner Index Rally $3040 - The 9th Phase. The downside support level is Mean Sup $2987, while the upside will carry the Phase 10 towards Outer Index rally $3125. To continue the rest S&P 500 story, see 'Stock Market Commentary & Analysis October 30, 2019 page, at TradingSig_dot_com.
Overseas markets
Asian region stock markets closed mixed on the day. Tokyo stock market saw a moderate rally, while H.K. Hang Seng and mainland Shanghai index had modest sell-offs. India Sensex ended with a firm rally.
Eurozone was seeing some softness in yesterday's market. London exchange prices were slightly lower amid worries of an early December general elections. French and German markets were detecting mild sell-offs as well.
Recent Posts
-
Weekly SP500 Chart and Technical Analysis
May 15, 26 04:21 PM
-
Weekly Euro Chart and Technical Analysis
May 15, 26 04:18 PM
-
Weekly Bitcoin Chart and Technical Analysis
May 15, 26 04:15 PM
-
Latest observation about silver and gold
Dec 27, 25 04:10 AM
-
The Debt Buyer Nobody Is Talking About
Apr 18, 25 05:40 AM