Weekly Market Review & Analysis For March 1, 2021

A healthy market this week for the Dow Jones, though not for the growth stocks or Nasdaq. The S&P 500 index rose 0.8% in this very volatile trading week. The Dow Jones bettered with a 1.8% gain, while the small-cap-Russell 2000 with -0.4% and the Nasdaq Composite with -2.1% proceeded to cool off from overheated market conditions. The latest higher interest rates were cited for the Nasdaq index's underperformance, which fell by 2.1%.
The energy sector with +10.1% soared 10%, bolstered by higher crude oil prices up +7.6%, closing at $66.09, the financials sector with +4.3% industrials sector with +3.1% followed suit with sturdy gains. The consumer discretionary sector with -2.8%, information technology sector with -1.4%, and real estate sector with -1.4% were sectors the lone hideouts.
Market news sentiment
The market began this week, as well as anyone could have expected. Each of the leading indices rallied at least 2.0% plus, as the U.S. the House passed the $1.9 trillion stimuli measure and passing the responsibilities over to U.S. Senate, manufacturing PMIs for last month out of America, Japan, and Europe exceeded projections. Warren Buffett hinted in his annual shareholder letter, "Never bet against America."
Nevertheless, investors and traders sold into market strength as long-term interest rates returned to their latest ascent activity. They were coming from the week session's intraday high to the week's intraday low. The broad S&P 500 index was down nearly 5%, and the heavy-loaded tech Nasdaq was down around 9%. The Ten-year yield momentarily matched last week's session intraday high posting at 1.61% before ending at 1.55%, or nine bps higher from a week ago.
The sudden spike in interest rates was catalyzed by steadfast expectations for inflation and economic growth, an acknowledgment from Chair Powell that the Federal Reserve will not meddle in the Treasury market at this point to check longer-dated rate yields, and by much stronger-than-expected employment rebound in February.
Non-farm payroll numbers show an increase of 379,000, and nonfarm private payrolls rising by 465,000. Both numbers followed by robust upwards revising data for January.
Selling action into strength ultimately yield to the classic BTD (buy-the-dip) mindset at the Friday session, notably when acknowledging that the underlying stock movements were much steeper than the index turn down. This rebound boosted by Plunge Protection Team helped the S&P 500 index to conclude the week in positive territory and above its critical Mean Sup $3,712.
Market elsewhere
All significant Eurozone equity markets end up higher as their respective PMIs numbers across the region increased, and the Europe's area jobless rate kept steady, notwithstanding extended draconian lockdowns in many European countries. In Germany, which proclaimed a progressive easing of restrictions commencing next week, the DAX Index reached a new intraday all-time high marking.
Asian regional equity markets were mostly higher following shakedown in a brief retreat regarding warnings about debt levels developing in China’s topmost banking regulator official. Notwithstanding, the Japanese stocks down small due to disappointing capital spending and employment data and a continuation of Tokyo’s coronavirus state of emergency action.
Bitcoin's wild week
What a roller coaster! The week started fantastically, but we are ending in the red. Is Bitcoin close to the bottom? Before February's end-of-month bond tantrum, the most unusual story in February was Bitcoin. Since the fall of 2020, Bitcoin has risen fivefold regarding - exactly, we are not entirely sure exactly why.
Generally, when security increases fivefold to top $1 trillion in market-cap valuation, there are obvious explanations. However, for Bitcoin, there are numerous, including augmented adoption of the coin and institutional approval/acceptance as a store of value, a modern currency, or as a unique asset class. But, Bitcoin has no apparent value justification other than market participants’ readiness to acquire it and loads of it.
Precious metals
After another metal turbulent trading week, Gold and Silver prices faded this week, with Gold declining to $1698.64 and Silver down to $25.20. It emerges that the bullion banks have covered a massive amount of Gold short positions. Net shorts are presently in the hole for about $23 billion, declining from $42 billion postings in January.
Notwithstanding, we remain to believe that the amount of monetary and governments, and fiscal stimulus central banks provide, the resulting debasement of fiat currencies and the inflationary consequence will support Gold, Silver metals, and precious metals stocks some time to come.
However, the precious metals are concentrated more on the potentiality for economic growth and overlooking the profitable precious metals mining market sectors' value; this landscape unquestionably presents a very attractive buying opportunity and port of entry for fresh capital.
Technical Analysis and Outlook
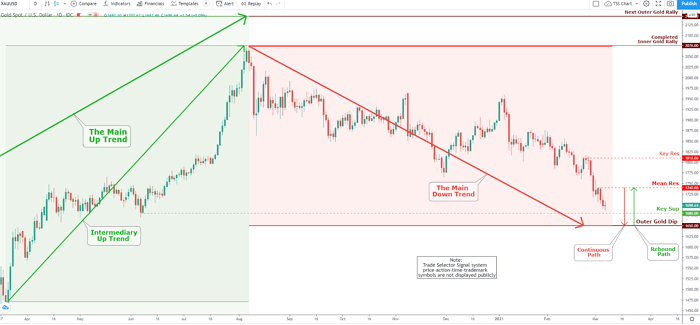
Gold is experiencing a massive amount of short-covering price action as the sentiment stance is low - followed by additional downward pressure. The upcoming week’s trading could very well mark the completion of the Outer Gold Dip $1,650 before a significant take-off: the expectation of this to happen is very high, with Mean Res $1,740 and Key Res $1,810 are vital targets, respectively.
Click the Image to Enlarge
Recent Posts
-
Weekly SP500 Chart and Technical Analysis
May 09, 26 06:02 AM
-
Weekly Euro Chart and Technical Analysis
May 09, 26 05:59 AM
-
Weekly Bitcoin Chart and Technical Analysis
May 09, 26 05:57 AM
-
Latest observation about silver and gold
Dec 27, 25 04:10 AM
-
The Debt Buyer Nobody Is Talking About
Apr 18, 25 05:40 AM