Market Insight & Commentary August 18, 2019

The equity market ended lower this week, in another turbulent ride on Wall Street. DJIA lost 1.5%, small-cap Russell 2000 was down minus 1.3%, The broad S&P 500 index dropped 1.0%, and the Nasdaq Composite by slipping 0.8% managing slightly better.
The Volatility Index VIX was up marginally on the week, however, ended back under 19 mark. Cryptocurrencies had a rough week, while Bitcoin managed to get back to above $10,000 Maginot line.
Among the turmoil in stocks and bonds, commodities sector looked confidently comfortable. The trading week commenced with traders and investors proceeding to seek protection in Gold and Silver markets.
Economic Growth Concerns
Economic growth, however, was briefly set aside after President Trump declared that the United States would pause the 10% tariff rate for some goods imported from China, mainly including laptops and cell phones, until December 15, 2019.
The announcement sparked a market rally which promptly evaporated following another bout of turmoil in the geopolitical scene: Brexit, Italy, Argentina, and India-Pakistan stand-off in addition to disappointing numbers from Germany and China.
The China National Team was particularly very visible in their stock market action this week - as the economic data falling along with the social color revolution in Hong Kong which endangers the territory’s position as a commercial gateway to Asia region.
The rush back to refuge briefly posted the yield rate on the ten-year note below the yield rate on the two-year note for the first time since 2007 turmoil, which is a rate inversion that has led each economic recession since the 1980s.
While the yield rate curve trajectory inversion and the market’s response indicates an elevated level of anxiety for the economic future, nevertheless, it is essential to keep it in real perspective.
The yield rate curve is not an absolute economic recession predictor, and various other indicators imply that a near-term recession is still unlikely. Global growth is stalling in many areas of the world, primarily due to trade disruptions rather than yield rates.
BTW, the average interval of time between the very first inversion and the beginning of each economic recession since the 1980s has been averaged roughly 18 months, with the range as short as ten months to a couple of years - therefore, take any reference to historical recession guides with a bit of a grain of salt.
Still, many global central banks are lowering interest rates to arouse economic growth or signaling interest rate cuts are coming. In the United States, consumer spending, as well as confidence, live strong, which isn't shocking granting that unemployment and inflation are historically low (If you believe that).
Since jobless claims are arguably a lot more reliable economic recession predictor than the yield rate curve this week’s United States economic numbers should give some relief as markets are stirring to oblige more dovish news from Federal Reserve this week.
One of the numerous complex discrepancies of American life in the 21st-century era is the world, according to Washington’s economic agencies and the world as it is.
In summary, things do not add up. What is more, the propaganda reports is thus far off the chart; it's utterly insulting to one inelegance.
S&P 500 Market
The S&P 500 market factor is that the time separating the primary rate inversion and subsequent S&P 500 index top, stocks have been typically advancing an additional 10%-12%, much more than the average decline post-top thus far, to time the markets is a challenging and presumably a money-losing approach (Don't get fancy and attempt to time it).
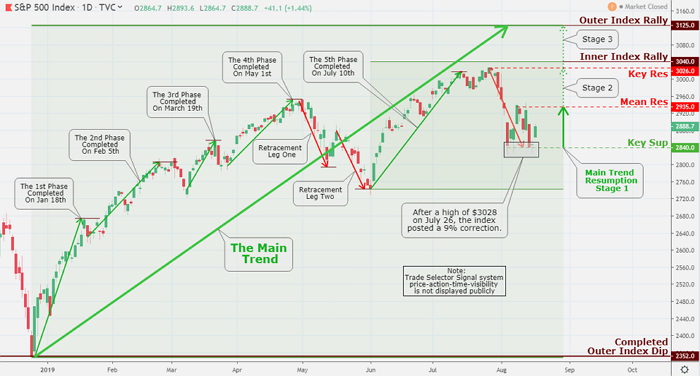
After topping at $3,028 on July 26, the broader S&P 500 index has lost 9%. A 9% slump is nothing at all. A 20% decline is required to get to the actual bear market territory. However, given the size and span of this running bull markets, as well as the monetary trickery that has perpetuated it, a 50% top to bottom decline or more is probable.
Final Thoughts
The current markets are the most exuberant set of events that I have been faced with during my 30 years of trading and investing. The circumstance that we are in present terms of the global economy and its bearing on our investments is a circumstance that nobody that I personally know of has ever witnessed before.
It has been a turbulent trading week, absolutely astonishing what is going on across the world. We have yield rates falling around the globe; the Precious market has stayed robust, stocks have been very volatile. This is the sort of investing and trading you do not observe very often in one's career, if ever.
We are entirely in uncharted waters. The stock market environment that we are in currently is indeed, really ripe for big surprises.
Chart Of The Week
Click the Image to Enlarge
Technical Analysis and Outlook
The index closed higher on August 16, and by doing so, reestablished its the main trend path. Major Key Sup 2840 is S&P 500 primary bear territory platform. On the upside, we have Stage 1 movement to Mean Res 2935, with Stage 2 & 3 to be approached in the near future.
Recent Posts
-
Weekly SP500 Chart and Technical Analysis
Apr 18, 26 06:05 AM
-
Weekly Euro Chart and Technical Analysis
Apr 18, 26 06:02 AM
-
Weekly Bitcoin Chart and Technical Analysis
Apr 18, 26 05:59 AM
-
Latest observation about silver and gold
Dec 27, 25 04:10 AM
-
The Debt Buyer Nobody Is Talking About
Apr 18, 25 05:40 AM