The yield curve spread - what exactly is it?
In general, the yield curve is a way of determining the cost of liquidity. The principal business model for the financial industry is to borrow money at a lower interest rate and then lend it out.
The most effective way for banks is to borrow at low short-term rates and then lend it at higher, longer-term rates - mortgages, for instance.
The yield curve spread represents the difference between the Ten-year yield and the Two-year yield U.S. Treasury notes. The yield spread of 0.01% is generally referred to as a basis point (bps).
Of course, the financial industry is more complex than this basic business model I've presented, and that spread is at the core of how lenders make their money.
When rates on short-term loans are low and the potential return from investments that last for a long time are very high, the demand for credit grows. Investors take out loans at low-interest rates and use this to make bets on items such as stocks.
Also, the cheap leading cause of price misalignments as discount rates that assume that the cost of capital will stay very low for a very long time. Investors today have an issue that is double-barreled:
1. Not to get caught in an asset bubble in the financial sector that is poised to implode.
2. The need to keep pace with the rising, structurally accelerating inflation rate.
Central banks and economy
The initial thing that central banks will do during an economic downturn is to lower interest rates. They do this to stimulate investing and borrowing to boost the economy and markets. For instance, in the 2008 recession, the Federal Reserve slashed interest rates by 4%.
By all means, the reverse is also true. When central banks are concerned about an economy overheating or high (sticky) inflation, the Fed will raise the interest rate. In time, short-term interest rates will be much more pricey than longer-term ones.
This means that the yield curve spread turns negative. This is known by the term "inverted" yield curve. When the spread inverts, investors should be aware and take note.
An inverted yield curve typically signal the onset of a recession
The yield curve has been the strongest indicator of future recessions. It is evident on the chart below the spread has shifted into negative territory before each significant slowdown (recession) in the past 45 years (shaded areas) which also includes the pandemic in 2020.
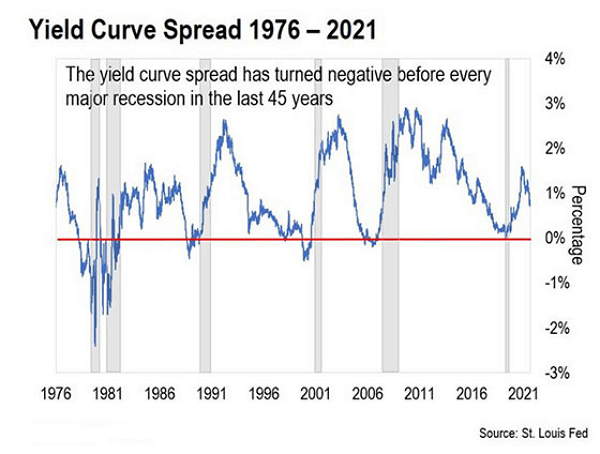
The logic is obvious. If the fundamental economic model for the finance sector is not profitable - when the short-term rate of interest rates are more expensive than long-term rates - banks cease lending.
Because the bull market thrives on liquidity, it removes a significant source of new capital for the economy. Then, it's just a matter of time until we experience recession.
The best part about the yield spread is that it provides us with a lengthy period to prepare for the possibility of trouble in the future. When the yield curve goes negative, then inverts - this can take anywhere between six months to two years before the onset of a recession shows up.
It was inverted in December 2005, around two years before the Great Recession was officially proclaimed. The other time the inversion did turn up was before the 2001 recession with an 18-months lead time.
What is today's yield curve interpretation suggesting to us?
Let's now look at how the yield curve spread appears in the present. The Two-year U.S. Treasury note yield stands at 0.93%, and the Ten-year U.S. Treasury note yield settles roughly 1.78% at the of writing. This difference is 85 bps.
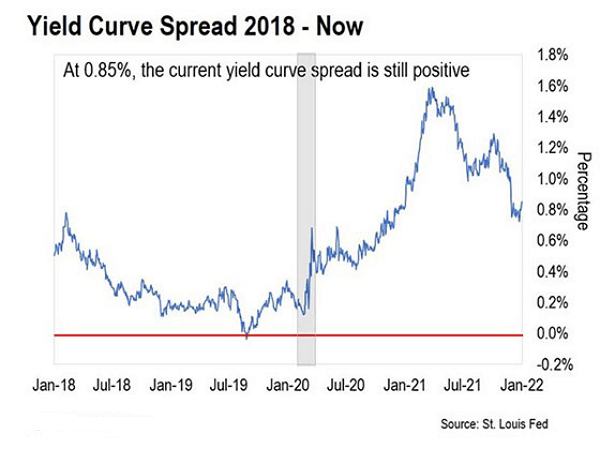
The positive spread of the reading and the historically long lead times for the signal suggests that there's no reason to be concerned about the space of the yield curve changing direction at the end of 2022. We bet that we will not have to worry about the recession until perhaps 2024.
This article was printed from TradingSig.com
Recent Posts
-
Weekly SP500 Chart and Technical Analysis
May 15, 26 04:21 PM
-
Weekly Euro Chart and Technical Analysis
May 15, 26 04:18 PM
-
Weekly Bitcoin Chart and Technical Analysis
May 15, 26 04:15 PM
-
Latest observation about silver and gold
Dec 27, 25 04:10 AM
-
The Debt Buyer Nobody Is Talking About
Apr 18, 25 05:40 AM