Stock Market Commentary & Analysis October 23, 2019
I do not make any claims of "enlightenment" about the stock market; however, more than 30 years ago, when I was learning to trade the futures, it bothered me no end that there was a lot "painting the tape" (Market manipulation) going on. One stock market index would turn higher/lower while not much else developed.
Put differently; there are so many indices that if one only picks one: for example, DJI Average, one can be seriously deceived. Yesterday morning, for example, Travelers (-11.76, -8.3%), along with McDonald's (-10.58, -5.0%), were weighing down the Dow index.
There are heaps of causes for this divergence problem: The broader S&P 500 index, for example, is more widespread. Including a lot more companies that make for a statistically more justifiable "integer n."
However, it is much more deep-rooted than that. The Nasdaq Composite index is full of pure gems of coming technology stocks. But, because they have been so pre-occupied with growth, may not meet the more-stringent New York Stock Exchange (NYSE) listing qualifications, what is the result? They do not get included except in a technology index.
In other words, to have this "wider view" of the stock market(s) became most apparent in the "tech and debt wreck" following the spring of 2000 market top. You can see, in the DJIA, and even the S&P 500 indices, the answer was muted. Yet in the technology indices, about $5 to $8 trillion (That with the 'T') dollars is challenging, and it is hard to sweep under the accounting rug.
That is what my work on the TradingSig.com website is based on: This is a simple trading/investing view that I am suggesting with a more realistic outlook of markets - intermediate short and long term – could be created by selecting a starting and ending price points and then equally trade or invest in particular indices.
So, in longish analysis, though, it is what will lead in the next several days of investing/trading as being extremely decisive between bulls and bears from market supremacy. As always small-cap Russel 2000 index leading the way...
Stock market and blame the news stream
There is one train of thought that argues the stock market is like a slow on the uptake when it comes to addressing the news reports. Inevitably, a significant shooting, bombing, or topple somewhere, and there is an immediate reaction: however, slow-motion, go-nowhere stories.
So, which way will the market break?
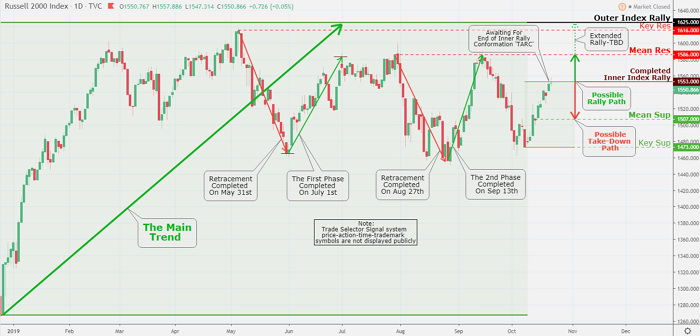
Well, now, I wish I could tell you - Although no one can, and no one does have a crystal ball. However, the small-cap Russell 2000 chart below might help.
Click the Image to Enlarge
Technical Analysis and Outlook
Currently, the Russell 2000 is between a rock and a hard place - awaiting conformation of the Inner Index Rally $1553 'TARC' or possibility to expel higher (odds 70% or better) to Mean Res $1586, and beyond - to be determined (TBD). If all fails on the upside, we have intermediate Mean Sup $1507.
Recent Posts
-
Weekly SP500 Chart and Technical Analysis
Apr 25, 26 06:26 AM
-
Weekly Euro Chart and Technical Analysis
Apr 25, 26 06:22 AM
-
Weekly Bitcoin Chart and Technical Analysis
Apr 25, 26 06:18 AM
-
Latest observation about silver and gold
Dec 27, 25 04:10 AM
-
The Debt Buyer Nobody Is Talking About
Apr 18, 25 05:40 AM