Weekly Market Review & Analysis For July 5, 2021

The S&P 500 market with +0.4%, DJI Average with +0.2%, and Nasdaq Composite with +0.4% lengthened small gains and finished the shortened week in record territory. The small-cap Russell 2000 index struggled this week's session and faded 1.1%.
The four days were trading week in observance for July 4th on Monday; hence the week's market action began with the Tuesday session when the S&P 500 succumbed to a streak of seven continuous record closes. Reportedly, traders and investors were concerned about peak growth as a result of a slowdown in the June ISM Non-Manufacturing Index and the scope of the Delta Covid variant spread.
The following day featured a mega-cap-driven rise before the peak of the growth anecdote resurfaced again as a justification to do some dumping on Thursday's session. The most influential source of anxiety was out of the U.S. Treasury market after the Ten-year note yield traded to as low as 1.25%. However, this was partly due to short-covering action since many participants demanded interest yields to go up and not downward.
In all fairness, growth concerns looked to be legitimate on Thursday's session after Japan lengthened its Covid state of emergency into Aug. 22 (To barring sports fans from the Olympics), also reports showing that the PBOC (People's Bank of China) could very soon truncate the required reserve ratio for its banks on account of slower growth outlook. The People's Bank of China did just that by cutting 50 bps last Friday.
Stock market and U.S. Treasury yields improved a bit on Thursday and resumed their bounce-back bids on Friday, with several attributing technical circumstances also a BTD (buy-the-dip) frame of mind for the springy price action. By the conclusion of the sloppy trading week, the growth stocks survived at the top of the leaderboard while the value stocks lingered: the Russell 1000 Value Index weakened 0.3%, and Russell 1000 Growth Index advanced 1.0%.
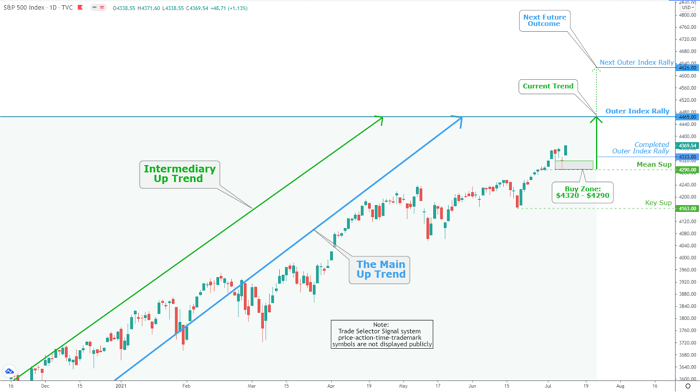
As stated on July 4, TradingView Update Idea (S&P 500 Weekly Daily Chart Analysis For June 14, 2021 Chart), the S&P 500 quickly reached our Outer Index Rally $4,333, the continuous rally is on to Outer Index Rally $4,465. The current Buy zone stands at $4320 - $4290, while Mean Sup $4290 is marked as the significant bottom.
The S&P 500 sector action
The S&P 500 consumer discretionary sector with +1.5% and the real estate sector with +2.6% were the sectors that finished with solid gains and were the only index sectors that climbed more than 1.0%. On the other hand, the energy sector with -3.4%, the communication services sector with -0.4%, and the financials sector with a -0.6% sector were the sectors that closed lower.
Interestingly, the West Texas Intermediate (WTI) crude oil futures market temporarily hit a six-year high crossing above $76 per barrel after The Organization of the Petroleum Exporting Countries (OPEC+) was powerless to agree to additional production increases. The International Energy Agency (EIA) published its seventh-straight weekly crude inventory draw on a relevant note.
Market action elsewhere
The Ten-year Note yield concluded the week at 1.36% or seven basis points under the previous Friday's settlement.
The Gold market has re-tested the lows of $1,761 on June 18 and formed a double-bottom on June 29 as the market is heading into the seasonally solid and active period and has fallen to oversold levels harmonious with tradeable lows across the past several years.
The Silver also shows technical strength as it digs out a sizeable bullish force above our Key Sup $25.75. The bounce is also pushing out from oversold levels harmonious with tradeable past lows, similar to Gold metal.
The COT (Commitment of Traders) report for Gold on Friday shows both Producers/Merchants and Swaps (commercial and bullion bank trading desks) categories building their short market positions in rising demand. The most extensive speculator category expansion was with Managed Money (The hedge funds) - BTW, none of this was shocking news.
Why July 19 will be important for Bitcoin
Mark your calendars; Monday, July 19th, will be an important day for Bitcoin. The coin shares worth $1.5 billion will be released on the market by then.
Grayscale Investments is a corporation that invests in cryptocurrencies like Bitcoin and Ethereum. Using Grayscale shares, individuals and corporations could gain Bitcoin exposure without holding them in a Bitcoin wallet. Traders and investors could buy these shares using USD or Bitcoin.
If one invests in a Grayscale share, you are obligated to hold this share for at least six months. After that period, you could sell it or keep it for a more extended period; subsequently, many shares will be released on July 19th.
After the shares become unlock the day before (July 18th), traders and investors will have the opportunity to liquidate these shares on the secondary market on Monday, July 19th.
As of this writing, the premium is negative 12.17%, which means Grayscale Bitcoin Trust BTC (GBTC) shares are 12.17% cheaper than the coin. As stated by David Grider of investment research firm FundStrat ''Investors looking for long-term passive bitcoin exposure are probably better off buying GBTC over spot bitcoin''. This, however, could be bearish for the price of Bitcoin unless the real coin will be bought on the market - Stay tuned.
Recent Posts
-
Weekly SP500 Chart and Technical Analysis
May 09, 26 06:02 AM
-
Weekly Euro Chart and Technical Analysis
May 09, 26 05:59 AM
-
Weekly Bitcoin Chart and Technical Analysis
May 09, 26 05:57 AM
-
Latest observation about silver and gold
Dec 27, 25 04:10 AM
-
The Debt Buyer Nobody Is Talking About
Apr 18, 25 05:40 AM