Weekly Market Review & Analysis For February 22, 2021

This week, it was a nasty market as the Nasdaq Composite, which plummeted 4.9% as long-term interest rates proceeded to increase sharply and elevate valuation-oriented anxieties. The broad S&P 500 index declined 2.5%, the small-cap Russell 2000 index dropped 2.9%, and the DJI Average slipped 1.8%.
The yield rate on the Ten-year U.S. Treasury note temporarily spiked to 1.61% this week, which caused the rate to climb above the S&P 500's dividend yield that stood at 1.51% and 52 basis points (bps) that were higher than where it began first of the month. However, it concluded the week with 1.46% closure or 11 bps higher than last week's market action. The Two-year yield rose three bps to finish at 0.13%.
Federal Reserve Chairman Powell discussed the interest rate situation in his semiannual testimony before U.S. Congress, emphasizing that it was the outlfor inflation and economic growth that has continued to add to the higher yields.
On the inflation scene, Chair Powell summed up that it could take two or three years for the U.S. economy to reach the Federal Reserve's inflation target. This means the Federal Reserve will stay exceptionally accommodative for the not too distant future.
Nonetheless, it was the abrupt interest rate of change that ran against risk sentiment and, in all probability, worked as a justification to take the money off the table.
Ten of the eleven S&P 500 sectors finished in negative territory, driven lower by the technology sector with -4.0%, consumer discretionary sector with -4.9%, and information sector with -5.1%, these were sectors with steepest declines. The iShares Russell 1000 Growth ETF dropped 4.5%, The PHLX Semiconductor Sector Index declined 4.8%, and the ARK Innovation ETF plunged 14.6%.
The vital energy sector posted a +4.3% gain, though, rallied alongside crude oil prices. Crude oil prices surged above $60 ($61.45) per barrel for the first time around in over two years; both the sector and crude oil ended the week with +4% gains, while copper surpassed a nine-year high price.
Eurozone economic numbers were positive, notably confidence indicators. While most Eurozone stock markets were pushed lower by increasing bond yields, Spain countered the trend as they were in the North American market. Spanish equities, which are particularly sensitive to United Kingdom travel, arose in reaction to the news of the easing of United Kingdom lockdown controls.
The stock market in Hong Kong declined after the city declared an increase in taxes on equity trading. The vulnerability in world-wide technology shares weighed on many Asian stock markets, including mainland China.
Other market action
After a powerful metal's performance on Monday, the Gold and Silver market traded much lower as the Comex exchange March contracts expired. By late Friday afternoon, Gold had suffered a net loss of $58 from the previous Friday’s closing at $1724, and silver was down over $1, finishing at $26.25 for the week.
Is this your moment to stock up on your cryptocurrencies? Coins such as Bitcoin, Ethereum, and Litecoin have decreased in value by more than 20%. Is this a buying or selling opportunity? You decide.
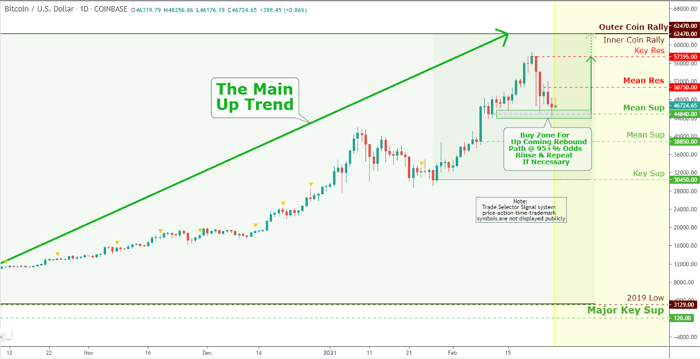
Click the Image to Enlarge
Recent Posts
-
Weekly SP500 Chart and Technical Analysis
May 15, 26 04:21 PM
-
Weekly Euro Chart and Technical Analysis
May 15, 26 04:18 PM
-
Weekly Bitcoin Chart and Technical Analysis
May 15, 26 04:15 PM
-
Latest observation about silver and gold
Dec 27, 25 04:10 AM
-
The Debt Buyer Nobody Is Talking About
Apr 18, 25 05:40 AM