Weekly Market Review & Analysis For August 16, 2021

The S&P 500 market with -0.6%, Dow Jones Industrial Average with +1.1% set record highs at the beginning of the week. However, the stocks became distracted by many concerns, which led to significant indices falling for the week. The S&P 500 fell 0.6%, while the Dow lost 1.1% and the Nasdaq Composite dropped 0.7%. With a 2.5% drop, the small-cap Russell 2000 was the biggest loser.
Briefly, concerns were raised about 1) supply chain disruptions, which could be worsened due to the Delta variant; 2) vaccine efficacy; 3) Fed's taper timeline. The July FOMC minutes reiterated comments about tapering sooner than expected. 4) China's regulatory crackdown. 5) Afghanistan after it had been overtaken in part by the Taliban. 6) Potential for a more significant market pullback.
There is something not right about these markets. These moves appear to be an attempt to distract the market away from something else. We won't be able to give you a complete picture until then.
The concerns were primarily growth-related when the market traded at record levels, and economic data wasn’t that good. Each of the following indicators was weaker than anticipated: retail sales, total housing starts, and Empire State Manufacturing Survey August. Both weekly initial and ongoing claims improved.
The S&P 500 fell 2.5% on Monday, at one point in the week, and on Thursday provided us with Rinse and Repeated buying opportunity (Mean Sup $4,368-Mean Sup $4,385 zone). Mega-caps were the first to rebound. However, a broad-based advance followed on Friday, as investors bought the dip in fear of missing out on a rebound rally.
However, the damage to cyclical stocks was already done. The energy sector closed the week at -7.3%, with crude oil prices plunged -6.12 or 9% to close at $62.25. Materials posted -3.1%, consumer discretionary posted -2.2%, financials posted -2.3%, and industrials with -2.3% were the sectors declining between 2-3%.
However, the health care sectors with +1.8%, utilities with +1.8%, real estate with +0.6%, consumer staples with +0.4%, and information technology with +0.4% were all sectors that ended the week in green. Microsoft (MSFT) saw a record 3.9% increase.
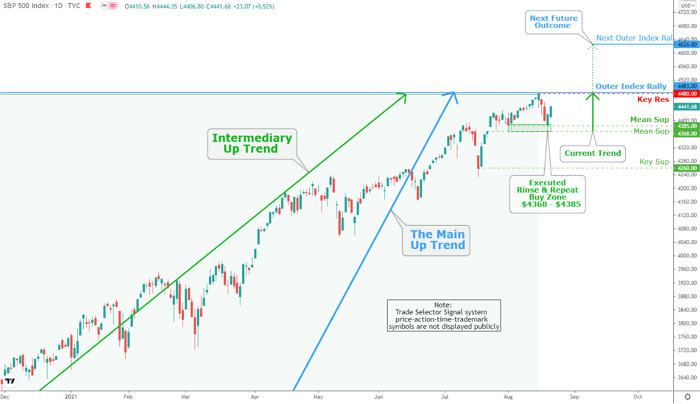
On Thursday ''Rinse and Repeat'' zone was triggered and allowed us a buying opportunity. The main target is Outer Index Rally $4,483 and newly created Key Res $4,480. The very low downside scenario is revisiting the ''Rinse and Repeat'' buying zone.
Market action elsewhere
Stock market(s) in the Asia-Pacific region were essentially lower on the Friday session. Japan's Nikkei225 Index fell by 1%, while H.K's Hang Seng Index plunged by 1.8%.
After experiencing weakness earlier in the day, primary European market(s) moved to positive territory. The U.K.'s FTSE 100 Index rose 0.4%, but the French CAC 40 Index and the German DAX Index ended the day higher by a 0.3% gain.
With growing concerns, longer-dated Treasuries increased in sympathy. The Ten-year yield fell four basis points to close at 1.26%. In the meantime, the Chicago Board Options Exchange (CBOE) Volatility Index rose 20% to close at 18.56 due to increased hedging interest.
Metals
The Gold market traded in a range as it closed out the week spent coping with its scars from the unpredicted and still unexplained flash crash on August 9th. This uncertainty continues to weigh on market participants and support Gold price, but Gold has not successfully broken $1,800.
The notable fact is that even small gains in Gold prices this week coincide with U.S. dollar trading at its highest level this year, reaching almost 94 marks.
Since its last year's breakout, Gold seems to have remained in a range. Similar patterns were seen in the mid-2000s, which preceded significant price increases. Consolidating long-term tends to lead to strong moves to the upside. We are currently in a similar situation, I believe.
If you did not know, the world still has a free enterprise system that works exceptionally well during an economic expansion (growth). However, it tends to collapse upon economic contraction. This is what's ahead, I'm afraid.
Bitcoin
Today, the bulls made their claim as Bitcoin (BTC/USD), price rallied 4.18% up to $49,400. This attracted investors who have been waiting for BTC's reclaim of the $50,000 Maginot mark.
The bullish market momentum increased, translating into the takeout of our Mean Res $47,950 and proceeding to our designated target Inner Coin Rally $50,130 as flagged on Weekly Daily Chart Analysis For August 9, 2021.
Recent Posts
-
Weekly SP500 Chart and Technical Analysis
May 23, 26 06:27 AM
-
Weekly Euro Chart and Technical Analysis
May 23, 26 06:24 AM
-
Weekly Bitcoin Chart and Technical Analysis
May 23, 26 06:16 AM
-
Latest observation about silver and gold
Dec 27, 25 04:10 AM
-
The Debt Buyer Nobody Is Talking About
Apr 18, 25 05:40 AM