Weekly Market Review & Analysis For August 10, 2020
It was another upbeat week for the stock market, and it was nearly a price action record-setting week for the benchmark S&P 500 index. The broad-based index grew 0.6% and almost closed at a historical record high couple times this week amid value-oriented and relative strength in the cyclical equities.
The DJI Average bettered with a 1.8% gain on all the other indices. The small-cap Russell 2000 index rose 0.6%, and the Nasdaq Composite improved by 0.1%.
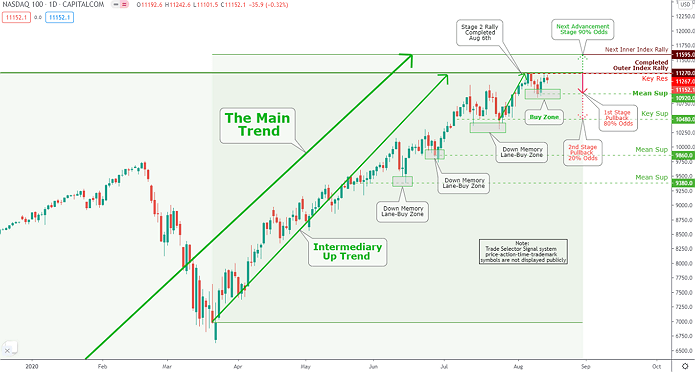
Click the Image to Enlarge
Technical Analysis and Outlook: NASDAQ 100 index's The Intermediary Up Trend, is standing at the completed state. The Trade Selector Signal TARC (proprietary symbol) formed at Key Res $11,267 has been retested and ready for the take-off to the next Inner Index Rally $11,595. However, a retest of Mean Sup $10,920 is not out of the question. To continue the rest of the market story, see the 'Weekly Market Review & Analysis For August 10, 2020" article.
Market action
With the bulk of second-quarter earnings behind the market, traders and investors watched economic numbers for the economy's newest indications. However, it seems to remain mostly positive.
Weekly initial jobless claims declined by 228,000 to print 963,000; this was the first reporting since March that unemployment claims marked-down below one million; retail sales improved by 1.2% in July and second-quarter preliminary labor productivity escalated by 7.3%.
The cyclicals took the numbers without missing a beat. The industrial sector posted +3.1%, energy sector scored +2.3%, consumer discretionary sector increased by +1.6%, materials sector rose +1.5%, and financial sector with the print of +1.3% advanced the most. The utility with -2.1%, real estate with -1.8%, and the communication services with -0.3% were the sectors that closed in negative territory.
Separately on an individual basis, Tesla mounted whopping 20% in three trading sessions after declaring a 5 to 1 stock split on Tuesday this week.
Market action elsewhere
Eurozone stock markets continued to climb higher due to last week’s Purchasing Managers’ Indices data, which revealed the area’s manufacturing sector increased for the first time in eighteen months. This week's survey of investor confidence conducted by Germany’s ZEW showed an unexpected increase to its highest posting in five years.
However, the stock gains were chilled on Friday after the United Kingdom government added France and numerous other countries to its blacklist of countries where new arrivals must quarantine for a minimum of two weeks.
The majority of Asian markets were higher, where the Japanese market was robust. In a holiday-shortened trading week, the Nikkei-225 index leaped higher after a Chinese manufacturing sector survey revealed a substantial expansion last month. But, stocks on the Shanghai Composite Index, barely showed an increase as United States-China trading relations tensions proceeded to ratchet higher.
The U.S. Treasury curve steepened measurably this week amid a sell-off in over the long term maturities. The Ten-year yield increased 15 basis points to close at 0.71%, while the Two-year yield has not changed at the previous 0.13% mark. The U.S. Dollar Index declined by 0.3% to close at 93.10. The West Texas Intermediate (WTI) crude futures climbed $0.88, or 2.1%, to close at $42.05/bbl.
In the cryptocurrency market, Ethereum closes the week with a bang! The price increased by a whopping 10% in comparison with Thursday's trading. However, not only Ethereum is doing well: actually, all major coins are gaining in value.
Precious metals
Gold and Silver underwent sharp declines this week, though in Thursday’s market prices staged a sharp recovery. On Friday, Gold was trading at down at $87, having hit a low mark of $1,864 on Wednesday. The Silver is at $26.40 range, being down $2.18 on the week session. On Wednesday, the metal posted a low point of $23.40.
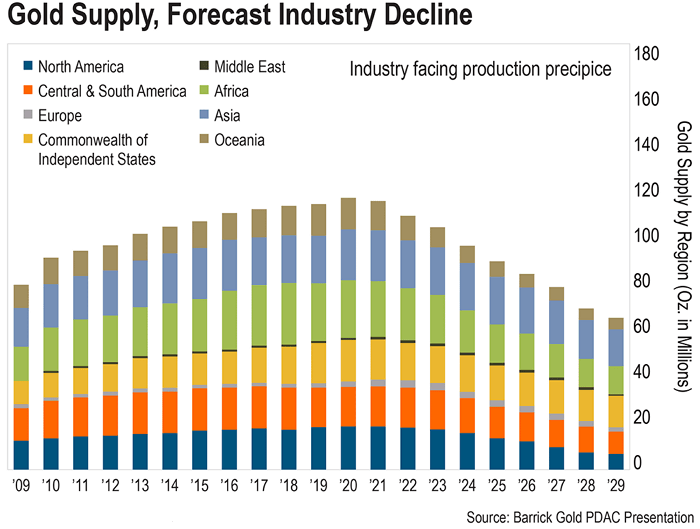
The chart below shows total world Gold production over the last ten years, and what is expected over the next decade from 2019 through 2029.
The takeaway is how challenging it is to produce and deliver the Gold. It isn't easy to find, access and extract from the ground, and sever it from rocks and many other minerals substances.
The bottom line is that the demand for gold will skyrocket over the next decade, as the masses around the world lose trust in fiat currencies. Therefore it is clear from the chart below, that current unprecedented printing scheme – that the supply of Gold will not match the increase in demand for the yellow metal - much higher prices lie ahead - Got Gold, Silver!
Recent Posts
-
Weekly SP500 Chart and Technical Analysis
May 09, 26 06:02 AM
-
Weekly Euro Chart and Technical Analysis
May 09, 26 05:59 AM
-
Weekly Bitcoin Chart and Technical Analysis
May 09, 26 05:57 AM
-
Latest observation about silver and gold
Dec 27, 25 04:10 AM
-
The Debt Buyer Nobody Is Talking About
Apr 18, 25 05:40 AM