Market Trend Commentary & Analysis October 2, 2019

The equity market gave back a lot more than 1% on Tuesday session, as new weak manufacturing numbers for last month (September) renewed economic growth concerns that drove traders and investors to rethink asset valuations.
Tuesday's 1.2% decline in the broader S&P 500 drove the index into additional pullback territory, towards Inner Index Dip $2928 and Mean Sup $2908 on a closing basis.
The DJI Average dove 1.3%, the Nasdaq Composite sank -1.1% while the small-cap Russell 2000 index with -2.0% posted comparable loss, against its large-cap peers.
The S&P 500 index took an abrupt nose dive soon after the release was posted in the morning (10 am EST) then began on a steady to low retreat throughout the remainder of the trading session.
All eleven S&P 500 index sectors ended lower, with the cyclical Industrials sector posting whopping -2.4%, Materials sector -2.3%, Energy sector -2.3%, and Financials sector posting -2.1%: these sectors were shouldering the brunt of the market damage.
Even the strong defensive-oriented sector, yet lavishly valued, Utilities with -0.3% as well as Consumer Staples also -0.3% of sectors ended lower. This was somewhat due to lingering uncertainties if the American consumer would continue resilient, given the very weakening employment situations in the manufacturing industry.
The best and worst market performing assets
As the market entered the final fourth quarter of a memorable 2019 year thus far, the last month was a partial reversal of the somewhat extreme price action that we witnessed in the month of August.
The huge winners in September were stock markets while precious metals and fixed income assets ruled the bottom of the board. Once it was all said and done, taking the exclusion of the currencies: 23 out of the 38 market assets settled with a positive total return, measured in local currency denominations while 22 did consequently did in U.S. Dollar adjusted terms.
Scanning across the principal winners in stock markets in September, topping the stat table were Eurozone Banks which delivered excellent return with +9.0% in regional currency denominations and +8.1% in U.S. Dollar adjusted terms. This was never the less the best achievement for the sector ever since March of 2017.
The little sell-off in interest rates certainly helped, but, the reality is that the September performance only recovered the earlier two months’ market losses. With that being stated, the financial sector did have to contest with some dissatisfaction around the European Central Bank meeting outcome.
Meantime, the overall global trend across stocks was Eurozone bettering America. Admittedly the STOXX 600 index with +3.7%, DAX 30 index raking in +4.1%, IBEX posting +4.9%, and FTSE MIB marking +4.0% all beat the broader S&P 500 index posting just +1.9% return.
And more distinctly outperforming the Nasdaq with only +0.5% gain where a mixture of a trade war and sector rotation, as well as Trump's impeachment tensions, seem to have weighed more.
In the Asian region, the Japanese Nikkei index posted +5.7% and outperformed the H.K Hang Seng index +1.9% as well as China's Shanghai Comp which printed +0.8%, while Emerging Markets equities market returned +1.9%.
As far as the laggards are concerned the last month, the Gold with -3.2% took the top spot, and more prominently Silver posting -7.5% both fell following a couple of months of stable performance, however, Q3 gains were still mighty.
In the sovereign bond markets, Treasuries and Bunds returned negative 1.1% and 0.9% respectively, yet, we did witness very positive returns for BTP's (Italy) marking positive 1.3% and Emerging Market bonds posting positive 0.7%.
In market terms of what was expected for Q3, notwithstanding the turbulence in August, there were yet 29 of 38 assets that achieved a positive total return; however, only 14 assets did so in U.S. Dollar adjusted terms owing to the more powerful greenback.
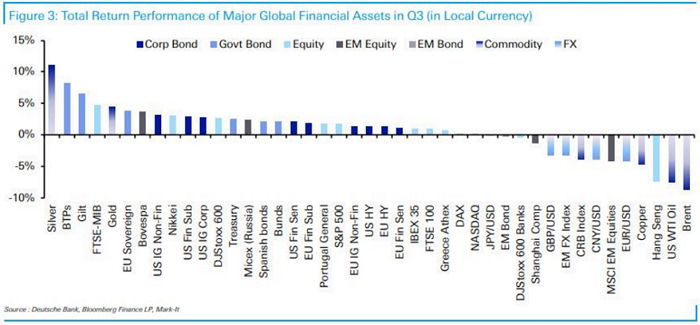
In regional currency terms, the first three spots went to the Silver metal with +11.0%, BTPs bonds showing +8.3%, and Gilts gaining +6.5%. Stock markets were somewhat mixed with modest gains for the FTSE MIB (Milano Indice di Borsa) index +4.8% and Nikkei 225 index +3.0%.
A more softened gain for the S&P 500 index with +1.7%, there was a little change for Eurozone Banks marking negative 0.5% and a striking underperformance for the H.K. Hang Seng index with negative 7.5% with the political rallies in Hong Kong.
Chart of the day
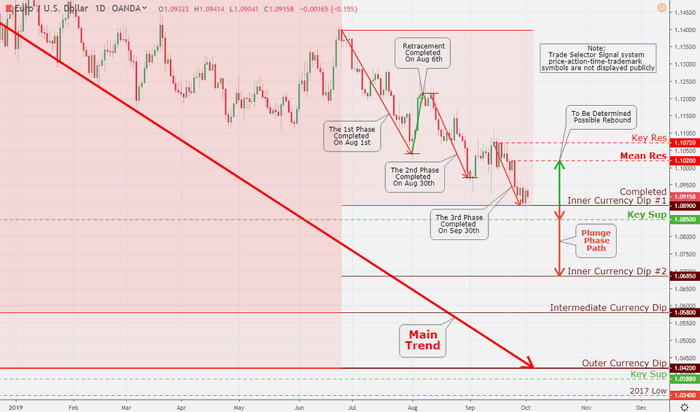
Euro Dollar completed its Inner Currency Dip $1.0890 - marked since June 25, 2019. The current action is forming complete Currency Dip BARC validation - to be determined with this current trading session to flag the rebound phase. The resistance points are Mean Res $1.1020 and Key Res $1.1072. On the downside, immediate markings are Key Sup $1.0850 and Inner Currency Dip #2 1.0685.

