Market Commentary & Analysis December 14, 2019

The market delivered another record week in which the United States and China struck a Phase One trade agreement that eased the tension circumventing the trade tariffs kicking-in on December 15.
The S&P 500 index ended up with +0.7%, DJI Average posted +0.4% gain, and the Nasdaq Composite Index increased +0.9% by setting new intraday highs, while the small-cap Russell 2000 index rose 0.3%.
The nine out of eleven S&P 500 sectors ended higher, with the leading information technology posting +2.0% gain bettering by a wide margin the semiconductor sector amid its strength.
The Philadelphia Semiconductor Index surged 4.2%. The real estate sector considerably underperformed by dropping -2.6%, while the communication services sector with -0.7% ended-up moderately lower.
Click the Image to Enlarge
Technical Analysis and Outlook
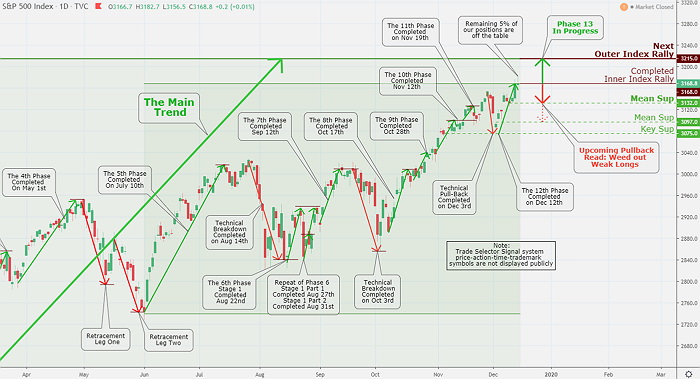
The trading week delivered another record. We have taken off the table the remaining 5% of our positions after the index hit Trade Selector Signal Inner Index Rally $3,168.
Currently, the market is the development of Phase 13; however, likely weed out weak long (Pullback) is probable. The current setup needs to be confirmed by Trade Selector Signal BARC or TARC signal - The Short or Long entry positions.
We will monitor the index very carefully for the next few days. On the downside, we have Mean Sup $3,132, Mean Sup $3,097, and Key Sup $3,075.
Market story
The market outcome was mostly solidified way before the trade agreement announced on Friday's session, which by the way, was anticipated given the increases posted previously and further markets quiet response after the official announcement.
The United States Trade Representative (USTR) affirmed that the trade tariffs on $250 billion of Chinese goods (imports) will be unchanged at 25%, the tariff charge on $120 billion of additional Chinese imported goods will be lowered from 15% to 7.5%, while China will be committed to buy the other United States farm goods.
U.S. agricultural buying will reportedly be somewhere between $40 to 50 billion over the next two years. U.S. President Trump appended that Phase Two talks will begin shortly, which should concentrate on issues concerning Intellectual Property (IP) rights and forced technology transfers.
Trade war dominated the news headlines and directed market price action; however, this week also involved Federal Open Market Committee as well as European Central Bank monetary policy decisions, a United Kingdom election, Consumer Price Index (CPI) for November, and the Retail Sales Report.
- Both central banks left interest rates unchanged, with the Federal Reserve flagging that no rate hike in 2020 will take place.
- The UK's Conservative Party (Tory) prevailed in a landslide victory, targeting a Brexit by January 31, 2020.
- A United States–Mexico–Canada Agreement (USMCA) agreement was struck, and a bipartisan budget compromise was reached, also.
- Consumer prices for November and Retail sales expanded much less than anticipated.
United States Treasuries had a week of another wild swing movement though eventually ended near their unchanged levels from last week. Both the Two-year yield and Ten-year yield dipped one basis point to 1.60% and 1.82%, each respectively.
The United States Dollar Index (DXY) declined by 0.5% to finish at 97.18. West Texas Intermediate (WTI) crude oil advanced solid +$1.66 or 2.8% to close at $60.11/bbl.
Recent Posts
-
Weekly SP500 Chart and Technical Analysis
May 09, 26 06:02 AM
-
Weekly Euro Chart and Technical Analysis
May 09, 26 05:59 AM
-
Weekly Bitcoin Chart and Technical Analysis
May 09, 26 05:57 AM
-
Latest observation about silver and gold
Dec 27, 25 04:10 AM
-
The Debt Buyer Nobody Is Talking About
Apr 18, 25 05:40 AM